New Jersey wine grape facts
Total acreage. There has been a heightened interest in grape growing in New Jersey over the past couple decades. The acreage of wine grapes doubled from 2002 to 2007 (USDA census of ag.) and continues to grow. The table below shows the increase in number of farms and acres from 2007 to 2012.
| 2007 | 2012 | |
|---|---|---|
| # Farms | 192 | 197 |
| # Acres | 1,043 | 1,082 |
| BEARING age # Farms | 157 | 170 |
| BEARING age # Acres | 791 | 878 |
Currently there are more than 190 farms statewide growing wine grapes.
New Jersey AVA facts
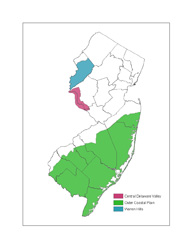
NJ AVAs. New Jersey is a small state (47/50) geographically, yet boasts three designated American Viticulture Areas (AVAs), Warren Hills, Central Delaware Valley, and the Outer Coastal Plain. Each region has unique combinations of climate, soil, topography to produce unique high quality wine grapes.
| AVA | # Total Acres | Color on Map |
|---|---|---|
| Warren Hills | 189,225 | Blue |
| Central Delaware Valley | 95,162 | Purple |
| Outer Coastal Plain | 2,109,073 | Green |
NJ suitability modeling facts
Suitability models. In addition to providing climate, soil, and land use maps on this site, we have combined these data layers to model wine grape suitability state-wide. The parameters listed below were combined using ESRIs ArcMap software in a simple unweighted overlay model and the output scaled from 0 to 4 (Not suitable to Most suitable).
| Model parameters | Classification | Rating | Data source |
|---|---|---|---|
| Number of days / year < -5F |
0-1
1-2 days/yr
2-3 days/yr
>3 days/yr
|
4
3
2
1
|
ZedX, Inc. |
| Growing degree days (base 50) |
<2000
2000-2500
2500-3000
>3000
|
1
2
3
4
|
ZedX, Inc. |
| Soil drainage |
Very poor
Poor
Somewhat poor
Moderate well
Well
Somewhat excessive
Excessive
|
0
0
0
3
4
3
1
|
NRCS
(compiled by Rowan Univ.)
|
| Slope |
0-5
5-10
10-15
> 15
|
4
4
2
0
|
NJ-DEP |
| Aspect (for slopes from 5% – 15%) |
0-89
90-134
135-224
225-269
270-360
|
1
3
4
3
1
|
NJ-DEP |
| Landuse / Landcover |
Agriculture
Barren land
Forest
Urban
Water
Wetlands
|
4
0
3
0
0
0
|
NJ-DEP |
Model results. The model is a simple first step at identifying suitable acreage and shows that New Jersey has enormous wine grape growing potential. Model results may be viewed both in the GIS maps and the Static maps sections of this web page.
Number of (#) and % of total acreage that is suitable for wine grape growing by AVA
| Moderately suitable | Most suitable | |||
|---|---|---|---|---|
| # acres | % acreage | # acres | % acreage | |
| Warren Hills | 51,319 | 27.12 | 42,544 | 22.48 |
| Central Delaware Valley | 7,596 | 7.98 | 21,783 | 22.89 |
| Outer Coastal Plain | 137,700 | 6.53 | 671,553 | 31.84 |
Number (#) of and % of total acreage that is suitable for wine grape growing by county
| Moderately suitable | Most suitable | |||
|---|---|---|---|---|
| # acres | % acreage | # acres | % acreage | |
| Atlantic | 17,985 | 4.60 | 102,340 | 26.19 |
| Bergen | 7,953 | 5.18 | 7,862 | 5.12 |
| Burlington | 53,979 | 10.28 | 156,020 | 29.72 |
| Camden | 6,340 | 4.35 | 30,035 | 20.62 |
| Cape May | 629 | 0.34 | 32,048 | 17.50 |
| Cumberland | 11,680 | 3.64 | 131,853 | 41.06 |
| Essex | 1,733 | 2.09 | 4,511 | 5.43 |
| Gloucester | 3,729 | 1.73 | 73,609 | 34.21 |
| Hudson | 0.00 | 0.00 | 0.00 | 0.00 |
| Hunterdon | 38,473 | 13.75 | 93,021 | 33.24 |
| Mercer | 3,107 | 2.12 | 32,692 | 22.33 |
| Middlesex | 2,669 | 1.31 | 24,794 | 12.20 |
| Monmouth | 15,614 | 5.02 | 57,889 | 18.62 |
| Morris | 59,544 | 19.32 | 23,541 | 7.64 |
| Ocean | 32,228 | 6.64 | 119,531 | 24.64 |
| Passaic | 25,451 | 20.05 | 3,444 | 2.71 |
| Salem | 5,220 | 2.35 | 92,252 | 41.53 |
| Somerset | 9,215 | 4.72 | 49,319 | 25.28 |
| Sussex | 151,823 | 44.30 | 12,352 | 3.60 |
| Union | 648 | 0.96 | 2,122 | 3.15 |
| Warren | 69,666 | 30.02 | 45,577 | 19.64 |